Monitoring API and token usage
Invite-only access
Access to Cleura AI Services is currently invite-only.
To monitor API and token usage, log into the Cleura AI Inference Dashboard with an Admin API key.
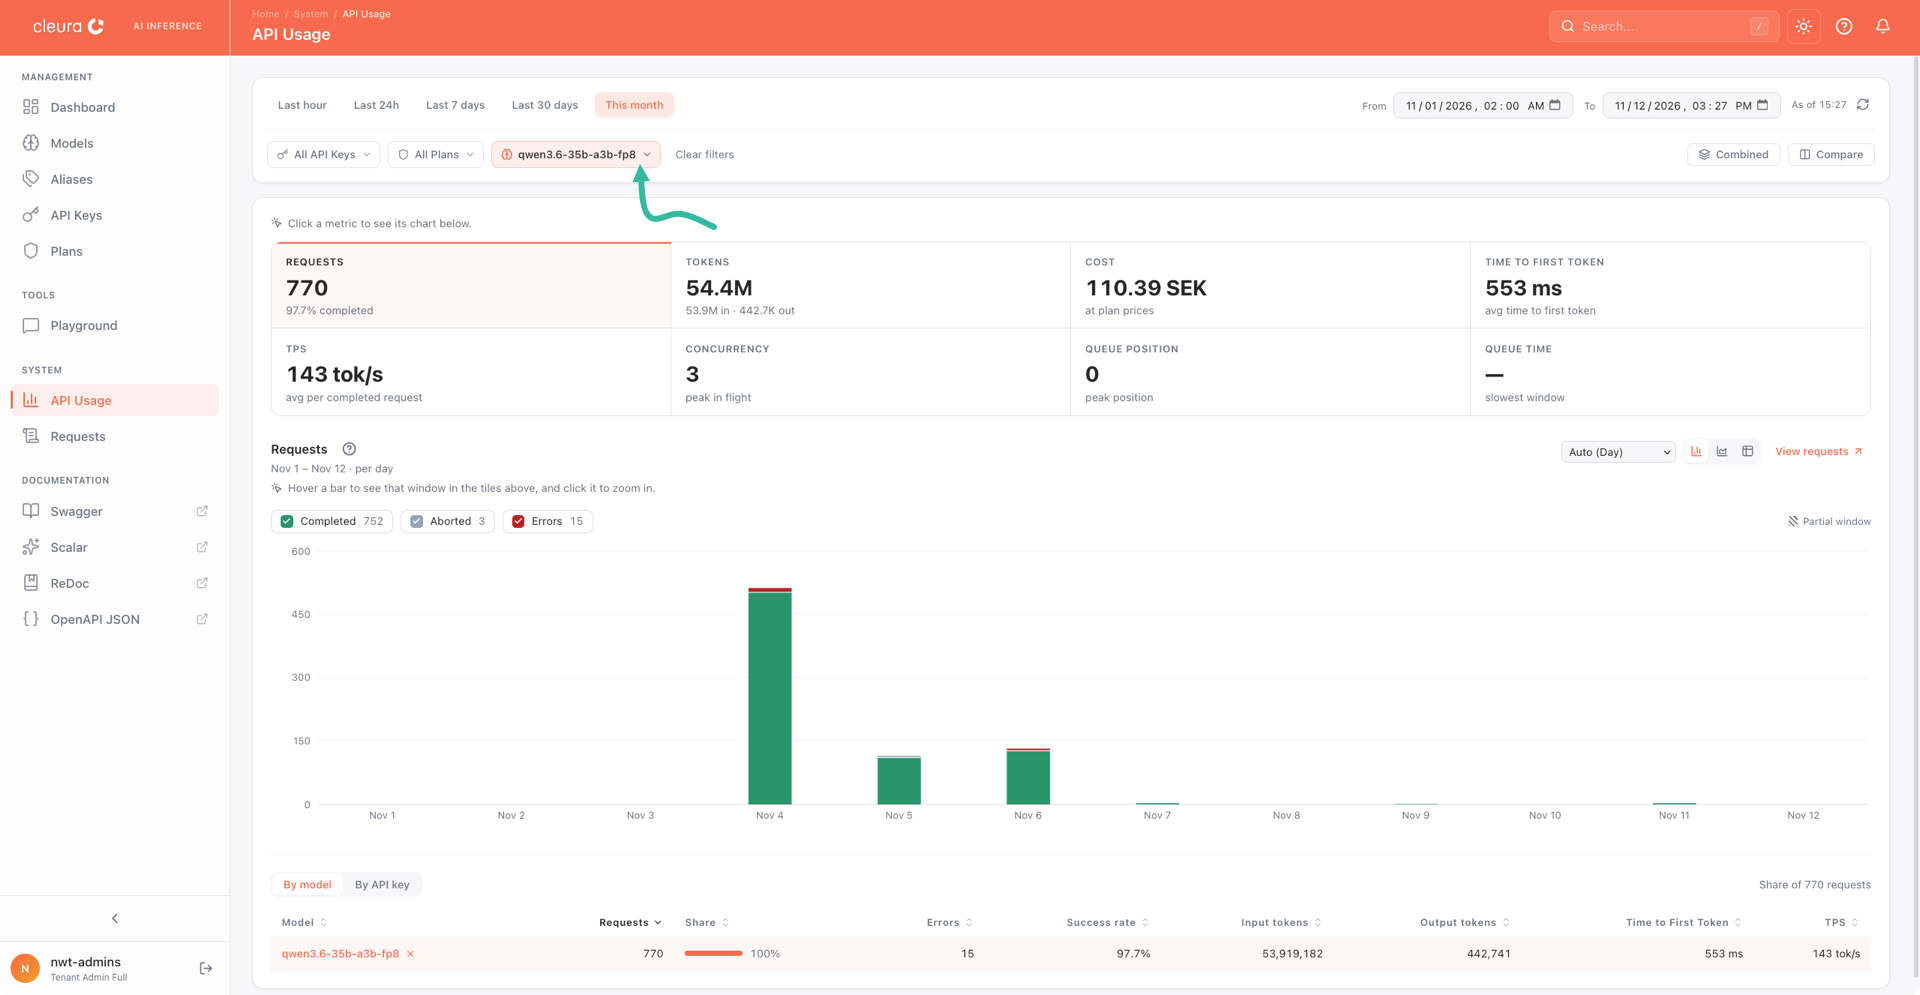
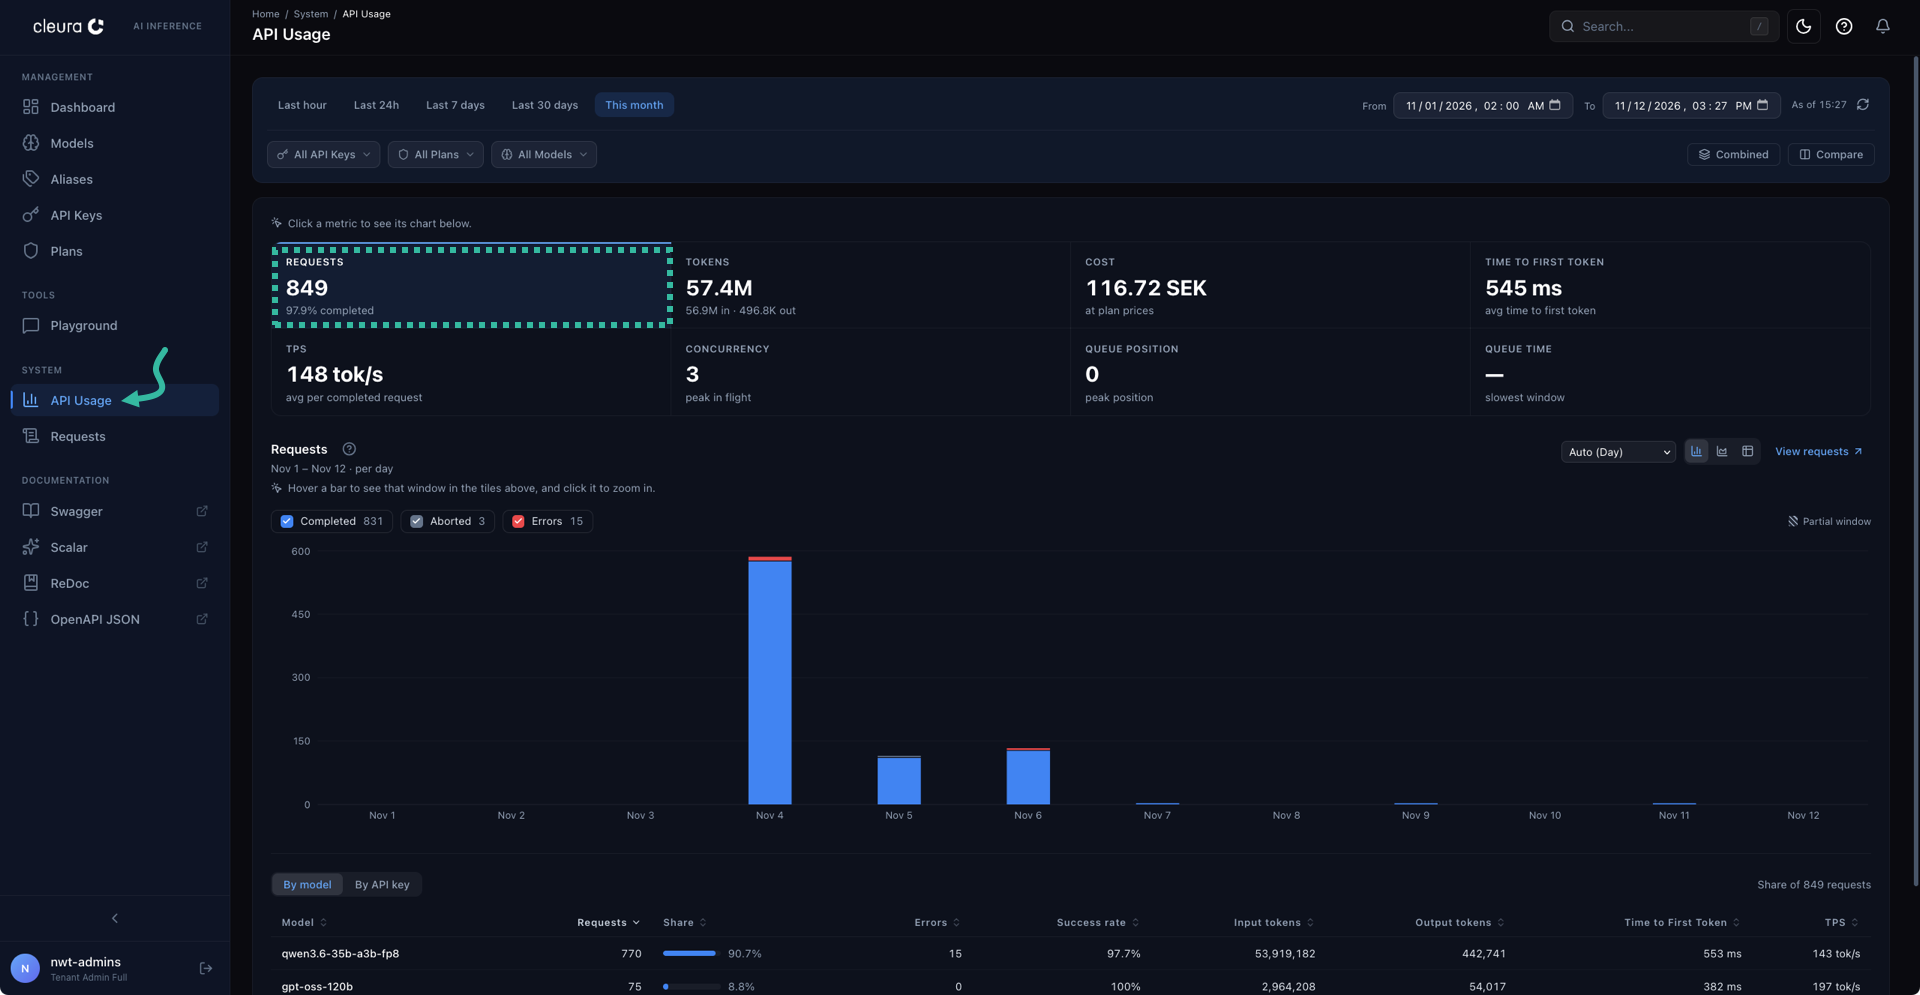
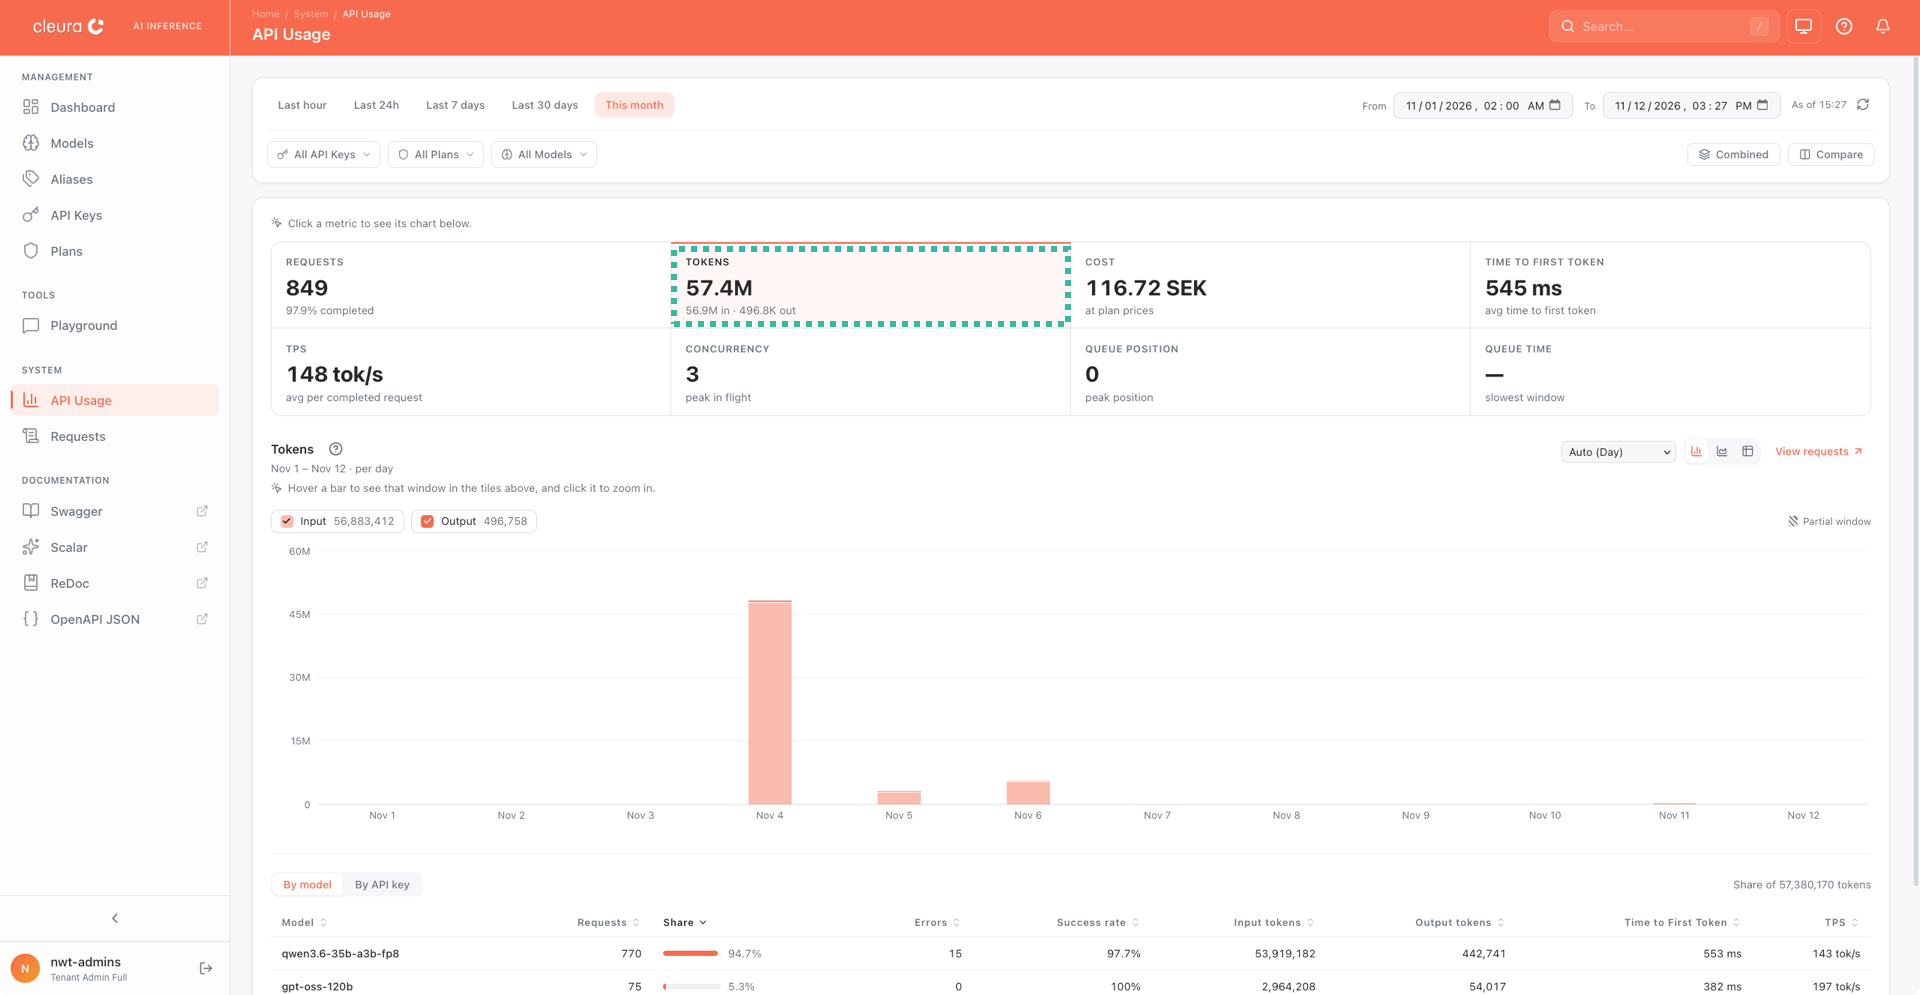
In the left-hand pane, click API Usage. The main pane shows this month’s usage, with the Requests metric selected and charted per day. The tiles above the chart summarize requests, tokens, cost, average time to first token, throughput, concurrency, and queueing. Below the chart, a table breaks the usage down by model or by API key.
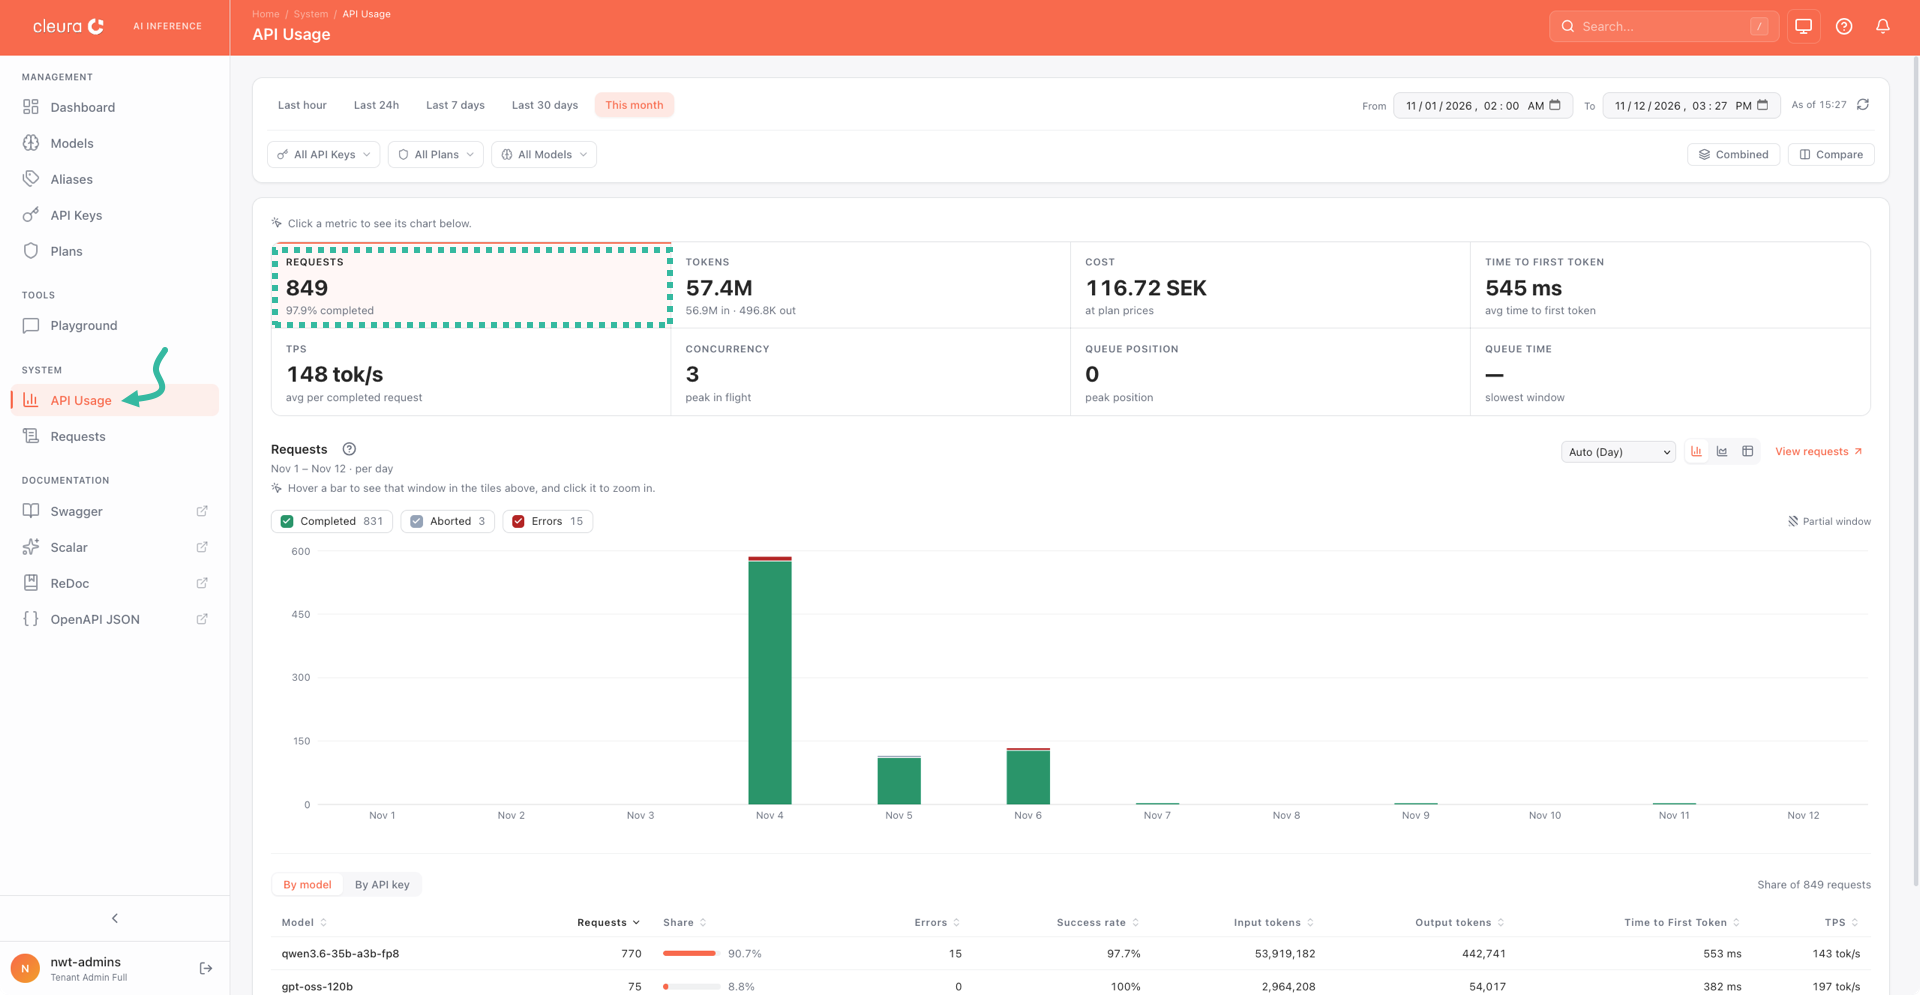
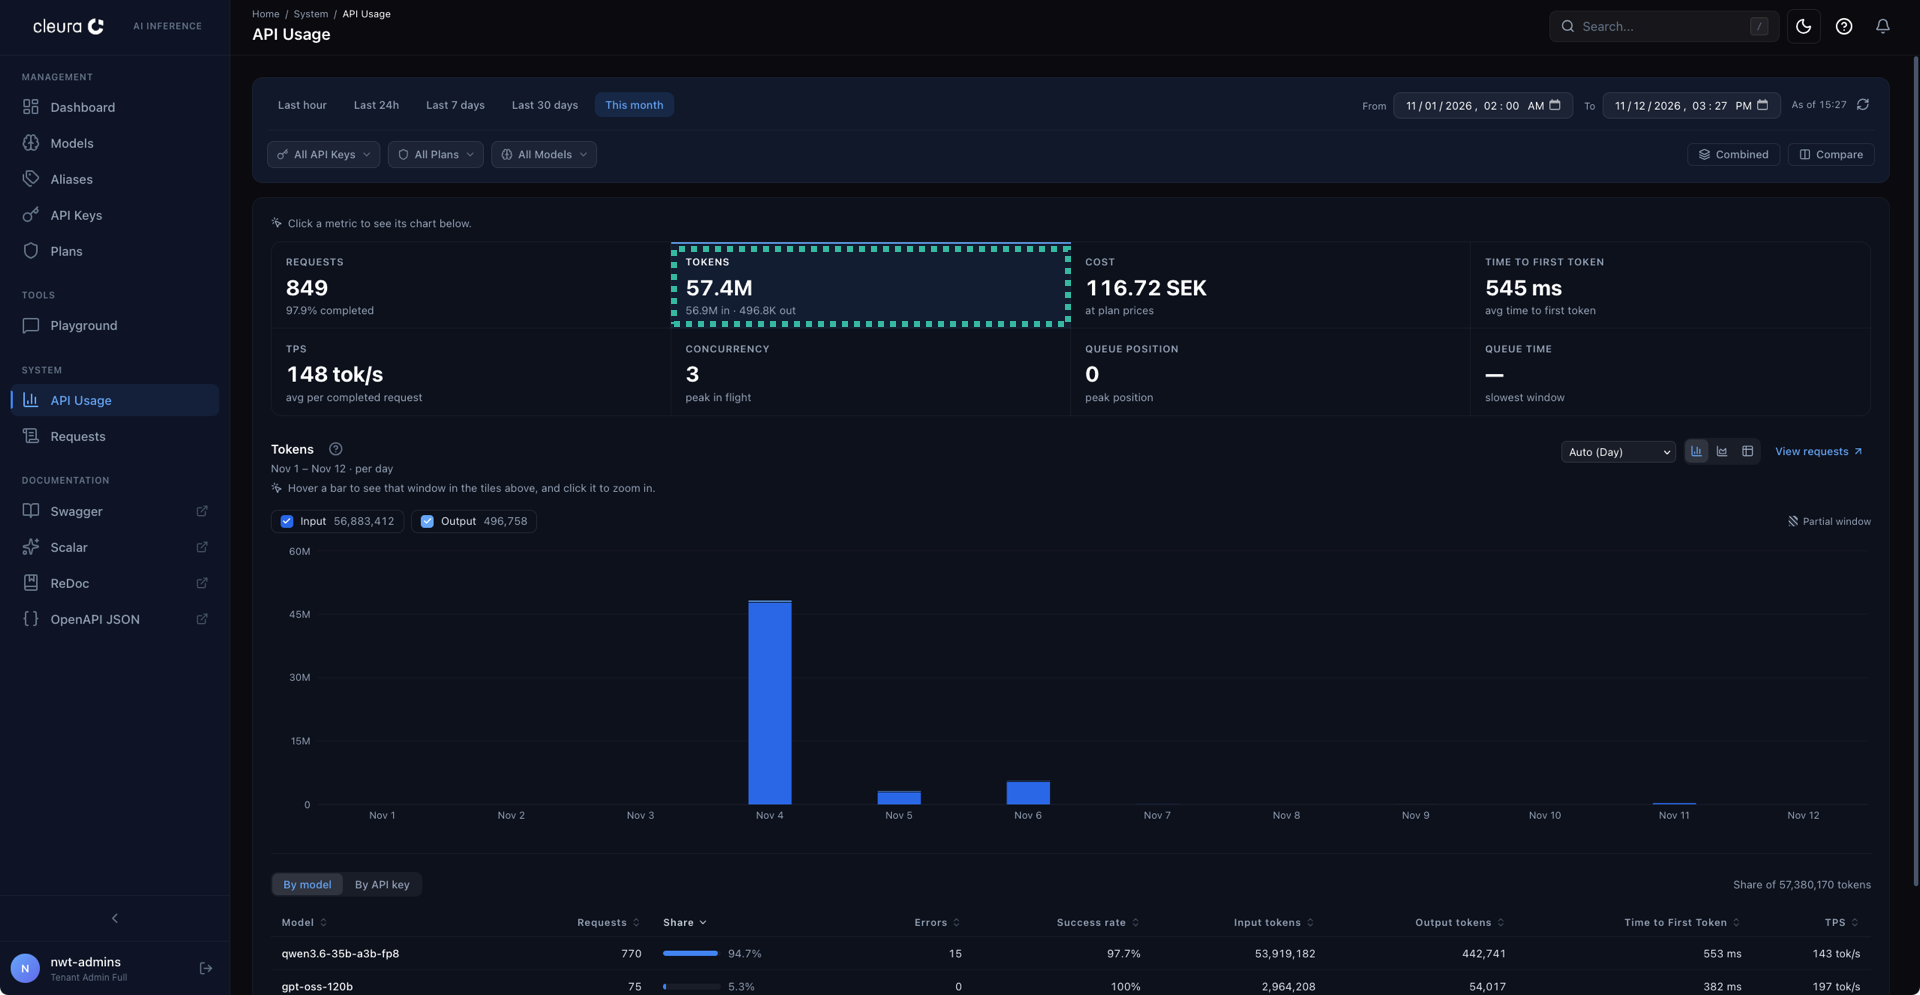
To chart token usage instead, click the Tokens tile. The chart then splits usage into input and output tokens per day.
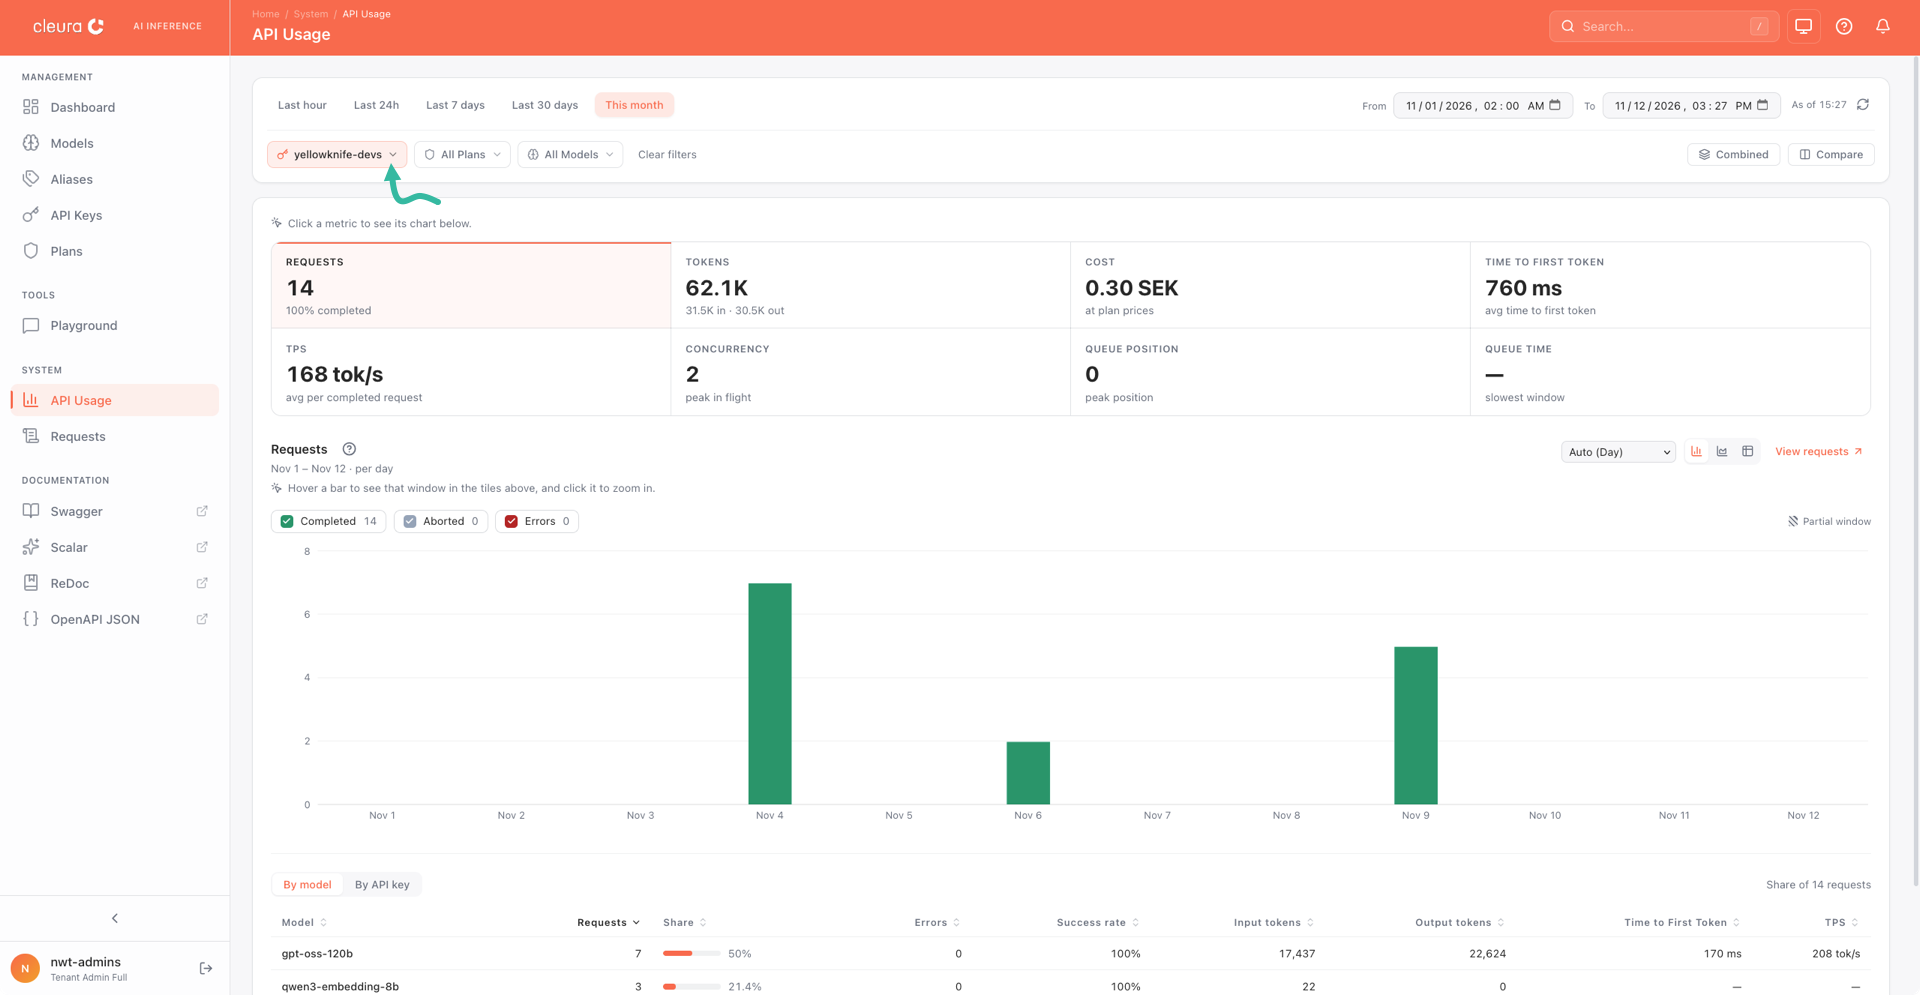
To narrow the figures to a single API key, choose one using the All API Keys drop-down menu above the tiles.
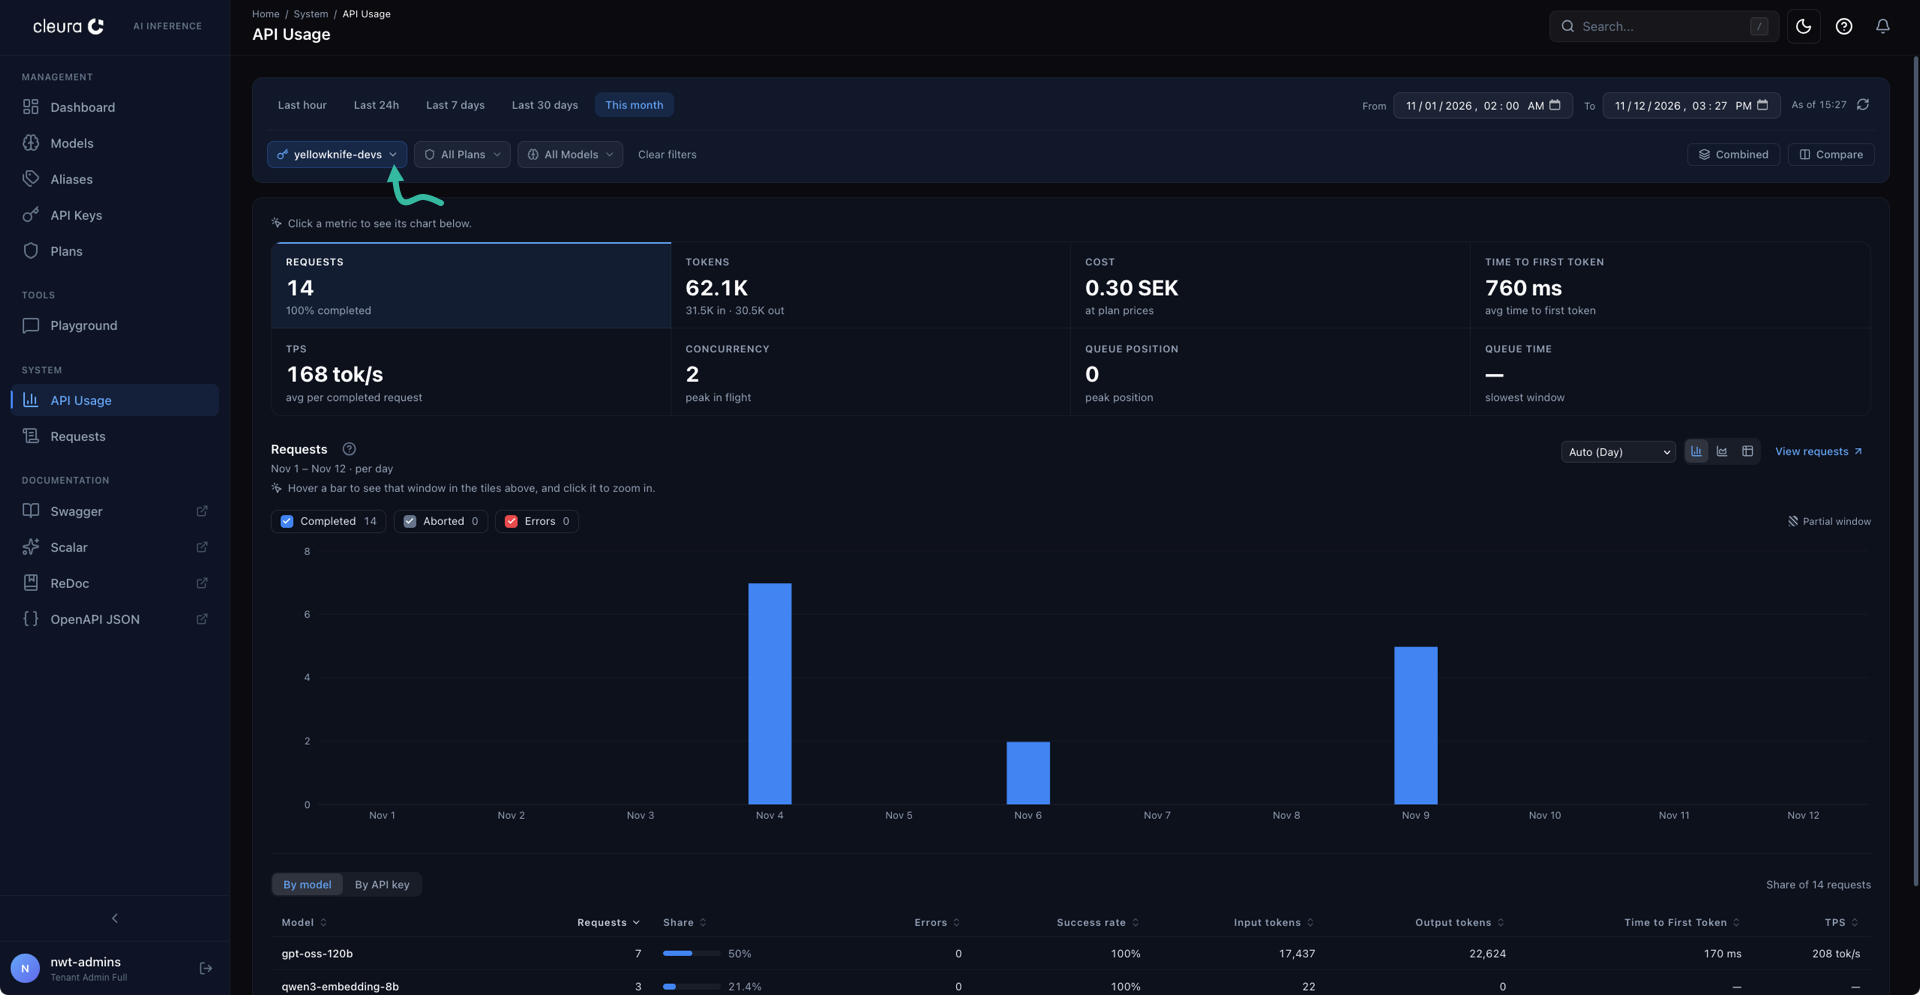
In the example below, the figures pertain only to the yellowknife-devs key.
To narrow the figures to a single model, choose one using the All Models drop-down menu.
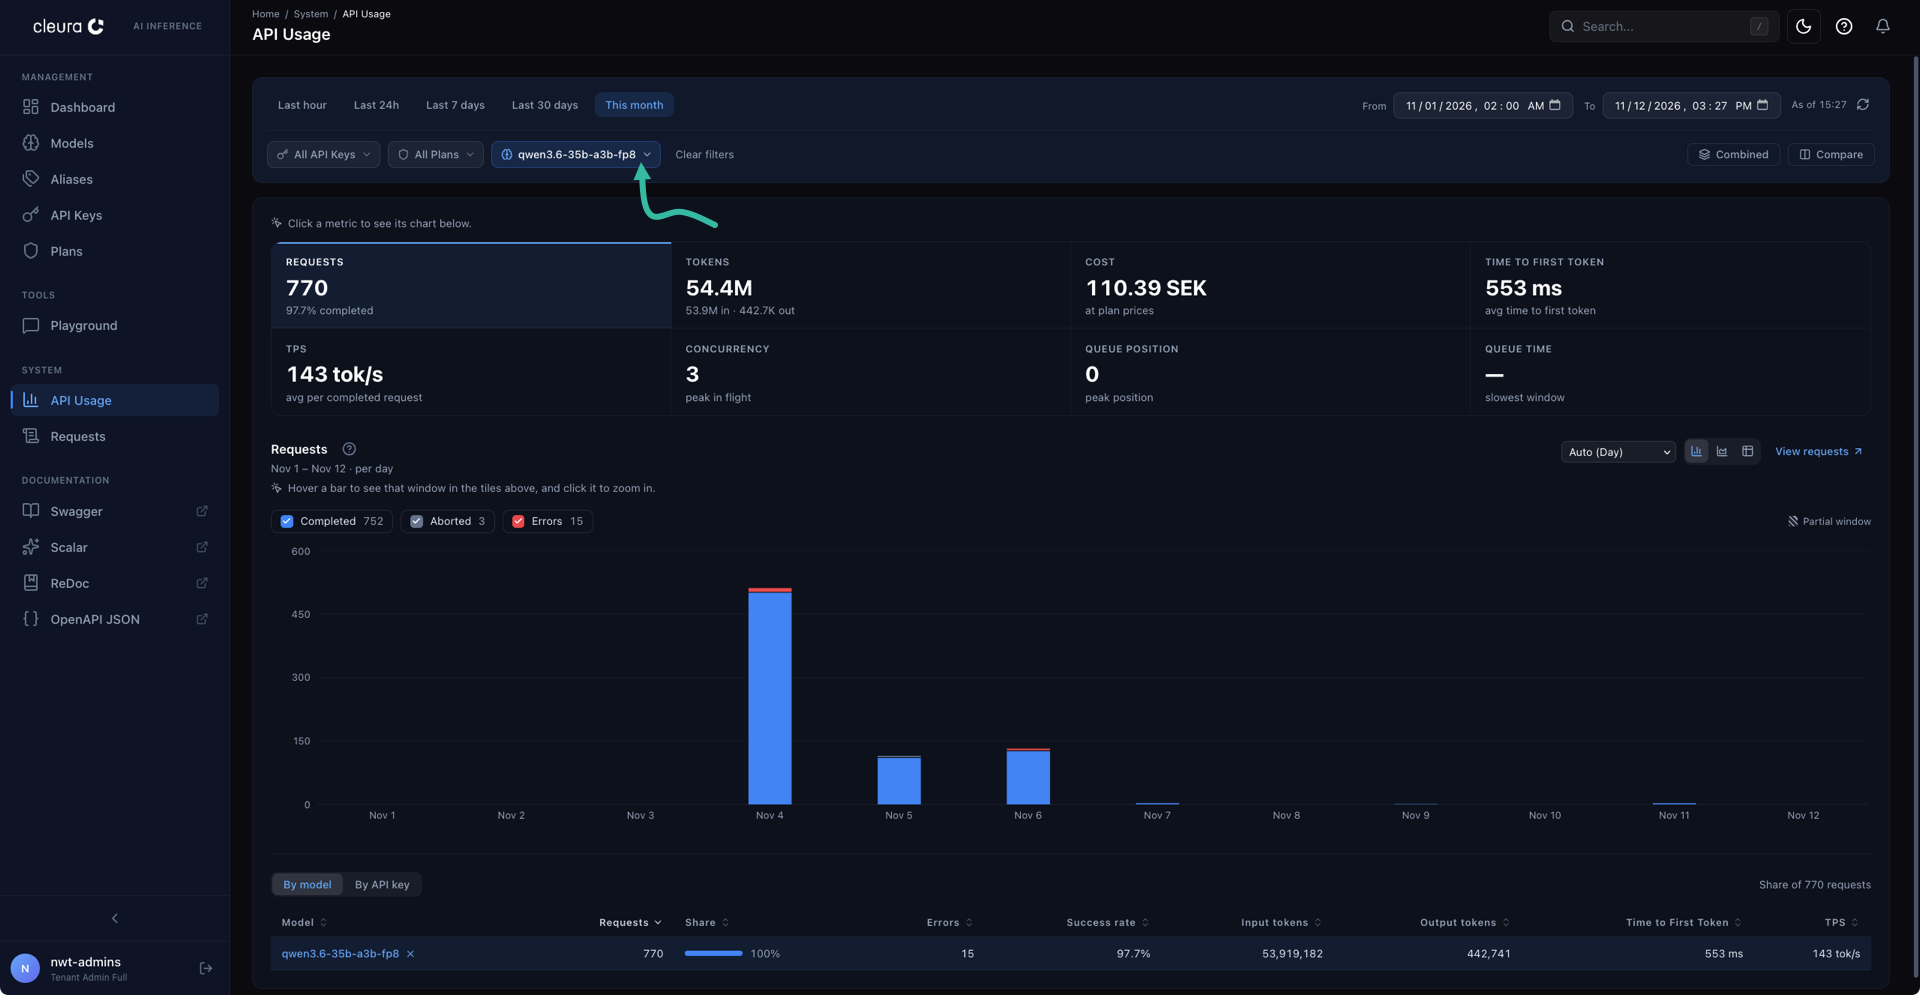
In the example below, only the qwen3.6-35b-a3b-fp8 model contributes to the statistics and to the chart.
To return to the unfiltered view, click Clear filters.